


Resources, July 2023 - June 2024
| Resources | 2024-2025 |
|---|---|
| Total Endowment, FY 2023 (as of end of year) | $59,000,000 |
| Operating Revenue | $139,000,000 |
| Student-to-Faculty Ratio (Fall 2023) | 7:1 |
Source: Office of Institutional Research
With our Catholic liberal arts heritage and over 100 degree programs, including nursing and marine biology, from bachelors through PhDs, we've got your options covered. Focus on arts and sciences, business, education, social work, communication, nursing, medical sciences, theology, or law. Take things further with personalized research and experiential learning opportunities, on and off-campus. Enhance your prospects with hands-on internships at some of the country's top organizations.

The Career and Experiential Learning Team educates students and alumni on the essential job searching and life skills to propel them to succeed in the increasingly competitive global marketplace.
Service-learning integrates relevant community service with course work and critical reflection to enrich the learning experience, foster social responsibility and civic engagement, and strengthen communities.

The Honors Program at Barry is designed to challenge, enrich, and prepare especially motivated students to pursue their fullest potential. By participating in a rigorous curriculum rounded out by an array of edifying and interactive events, students explore crucial issues that we face in our daily lives. Students are given the space for discussion and debate and the opportunity to learn from experts in their fields. The Office of Financial Aid can assist with determining eligibility for the Honors Program.

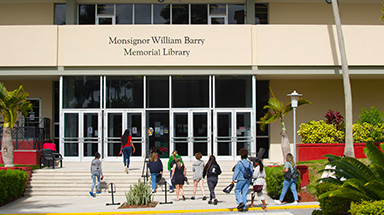
The Monsignor William Barry Memorial Library is located in the center of the beautiful Miami Shores campus of Barry University. The Library is named in loving memory of Monsignor William Barry, one of the founders of Barry University and an inspirational figure in the Catholic Church within the Archdiocese of Miami. The extensive Library research collections include more than 950,000 physical items, over 40,000 print and on-line journal subscriptions, and several thousand on-line books and streaming video resources.
At Barry University, you will experience a small community atmosphere where you can always rely on our administrators and faculty for advice, encouragement and personal attention. We take great pride in giving individual attention from the very beginning. You can start building a personal relationship with one of our admissions counselors who will help answer any questions, and guide you through the entire admissions and enrollment process.

Continuing Education (CE) offers a variety of courses and non-credit programs designed to respond to the diverse educational interests and lifelong learning needs of individuals of all ages. We offer certificate, credential exam preparation, and licensure programs for professional and personal enrichment.

High school students: Get a jump-start on your college education with dual enrollment courses from Barry University! You can earn high school and college credit at the same time, right at your own school.

Barry University is committed to provide you with a dynamic and flexible approach to your degree pathway through our online courses and degree programs. We understand that balancing academics, work, and personal commitments can be challenging. That's why our online offerings are designed to fit seamlessly into your busy schedule, allowing you to pursue your educational goals without compromising on other important aspects of your life.

We are committed to providing programs and services that are guided by Barry University's rich educational mission and intended to enhance your Barry experience. Through partnerships with others in the university community, we aim to create experiences that will help transform you into leaders for a just and humane world.
We are an NCAA Division II school and a member of the Sunshine State Conference with 12 varsity teams, including men's baseball, basketball, golf, soccer and tennis; and women's basketball, golf, rowing, soccer, softball, tennis and volleyball. So far, we've won 24 NCAA championships, had 338 All-Americans, 413 Scholar All-Americans, and nine NCAA "Women of the Year" finalists, the most of any Division II school. Not bad at all, but we're going for more.
For students currently enrolled in classes at Barry, we have a wealth of resources you can tap into to bring ease and efficiency to your university experience. Get the help you need with administrative or financial questions, or check out course catalogs to help plan your schedule by semester. All the information you need to excel is at your fingertips.


| Resources | 2024-2025 |
|---|---|
| Total Endowment, FY 2023 (as of end of year) | $59,000,000 |
| Operating Revenue | $139,000,000 |
| Student-to-Faculty Ratio (Fall 2023) | 7:1 |
Source: Office of Institutional Research
| Degree | Women | Men | Total | % Awarded to Florida Residents |
|---|---|---|---|---|
| Baccalaureate Degrees | 340 | 179 | 519 | 61% |
| Masters Degrees | 654 | 208 | 862 | 57% |
| Specialist Degrees | 30 | 10 | 40 | 70% |
| Doctoral Degrees -Research & Scholarship | 232 | 150 | 382 | 64% |
| Doctoral Degrees - Professional Practice | 11 | 1 | 12 | 58% |
| Total | 1,267 | 548 | 1,815 | 60% |
Source: Office of Institutional Research
| Student Type | Full-time | Part-time | Total | ||
|---|---|---|---|---|---|
| Undergraduate | Traditional | First-time Freshmen | 626 | 1 | 627 |
| Transfer-in | 138 | 1 | 139 | ||
| Continuing | 1,267 | 41 | 1,308 | ||
| Non-degree-seeking | 7 | 7 | 14 | ||
| Dual enrollment | 0 | 1,001 | 1,001 | ||
| Traditional Undergraduate Total | 2,038 | 1,051 | 3,089 | ||
| Non-Traditional (PACE) | Transfer-in** | 10 | 12 | 22 | |
| Continuing | 59 | 62 | 121 | ||
| Non-Traditional (PACE) Undergraduate Total | 69 | 74 | 143 | ||
| Undergraduate Total | 2,107 | 1,125 | 3,232 | ||
| Graduate & Professional | Master’s | Entering | 523 | 198 | 721 |
| Continuing | 595 | 556 | 1,151 | ||
| Master’s Total | 1,118 | 754 | 1,872 | ||
| Doctoral – Research & Scholarship | Entering | 35 | 6 | 41 | |
| Continuing | 87 | 175 | 262 | ||
| Doctoral – Research & Scholarship Total | 122 | 181 | 303 | ||
| Doctoral – Professional Practice | Entering | 328 | 41 | 369 | |
| Continuing | 767 | 161 | 928 | ||
| Doctoral – Professional Practice Total | 1,095 | 202 | 1,297 | ||
| Specialist’s | Entering | 0 | 3 | 3 | |
| Continuing | 0 | 22 | 22 | ||
| Specialist’s Total | 0 | 25 | 25 | ||
| Non-degree-seeking | Entering | - | 83 | 83 | |
| Continuing | 1 | 12 | 13 | ||
| Non-degree-seeking Total | 1 | 95 | 96 | ||
| Graduate & Professional Total | 2,336 | 1,257 | 3,593 | ||
| Grand Total | 4,443 | 2,382 | 6,825 | ||
*For the purposes of IPEDS reporting, Foreign Graduate Students (n =40, FTE =26) enrolled in the Bahamian cohort within the School of Education are excluded from the enrollment counts.**All Non-Traditional undergraduate students entering Barry for the first time are considered transfer-in students, even if they do not submit a college transcript as part of their application, because they receive college credit for their past experiences. As such, they are not considered first-time freshman in the traditional sense. Source: Office of Institutional Research
*For the purposes of IPEDS reporting, Foreign Graduate Students (n=40) in the Bahamian cohort within the School of Education are excluded and Dual-Enrollment Students (n=1,001) are included in the enrollment counts (Fall 2022). Source: Office of Institutional Research
Source: Office of Institutional Research
| Academic Level | Total 12-month Unduplicated Headcount | FTE Enrollment |
|---|---|---|
| Undergraduate | 4,484 | 2,894 |
| Graduate | 4,383 | 3,524 |
| Total | 8,866 | 6,418 |
*Unduplicated headcount: Each student is only counted once for the entire academic year. Source: Office of Institutional Research
| Student Type | Women | % of Total Enrollment* | Men | % of Total Enrollment* |
|---|---|---|---|---|
| First-time Freshmen | 386 | 6% | 241 | 4% |
| Traditional Undergraduate | 1,819 | 27% | 1,270 | 19% |
| Non-Traditional (PACE) Undergraduate | 89 | 1% | 54 | 1% |
| Master’s | 1,435 | 21% | 437 | 6% |
| Doctoral – Research & Scholarship | 235 | 3% | 68 | 1% |
| Doctoral – Professional Practice | 810 | 12% | 487 | 7% |
| Specialist’s | 23 | 0.3% | 3 | 0.03% |
| All Students** | 4,488 | 66% | 2,337 | 34% |
*% of 6,825 students. **All Students category is calculated by adding Traditional UG, Non-Traditional (PACE) UG, Master’s, Doctoral Research & Scholarship, Doctoral Professional Practice, and Specialist’s categories, as well as including Graduate Non-degree Student body count. Source: Office of Institutional Research
| Race/ Ethnicity | First-time Freshmen | Traditional UG | Non-Traditional UG | Master’s | Doctoral Research & Scholarship | Doctoral Professional Practice | Specialist’s | Total* | % Of Total Enrollment** |
|---|---|---|---|---|---|---|---|---|---|
| Non-resident Alien | 87 | 343 | 5 | 145 | 28 | 26 | 1 | 550 | 8% |
| Hispanic | 213 | 1,021 | 56 | 545 | 75 | 372 | 6 | 2,106 | 31% |
| American Indian or Alaskan Native | 0 | 6 | 0 | 6 | 1 | 0 | 0 | 13 | 0% |
| Asian | 4 | 56 | 1 | 121 | 7 | 76 | 1 | 263 | 4% |
| Black or African American | 208 | 826 | 54 | 567 | 122 | 177 | 10 | 1,775 | 26% |
| Hawaiian or Pacific Islander | 0 | 1 | 0 | 3 | 2 | 3 | 0 | 9 | 0% |
| White | 75 | 643 | 21 | 265 | 49 | 560 | 4 | 1,582 | 23% |
| Two or more races | 29 | 132 | 2 | 31 | 2 | 44 | 2 | 215 | 3% |
| Unknown | 11 | 61 | 4 | 189 | 17 | 39 | 1 | 312 | 5% |
*Total category is calculated by adding Traditional UG, Non-Traditional (PACE) UG, Master’s, Doctoral Research & Scholarship, Doctoral Professional Practice, and Specialist’s categories, as well as adding Graduate Non-degree Student body count.
**Total based on Fall Enrollment of 6,836 students. Percentages may not add up to 100% due to rounding error.
Source: Office of Institutional Research
| Student Type | Mean | Median | Standard Deviation |
|---|---|---|---|
| First-time Freshmen | 18.3 | 18 | 0.83 |
| Traditional Undergraduate | 19.6 | 19 | 4.15 |
| PACE Undergraduate | 39.1 | 38 | 9.51 |
| Master’s | 30.9 | 28 | 8.92 |
| Doctoral – Research & Scholarship | 44.0 | 43 | 10.8 |
| Doctoral – Professional Practice | 29.9 | 27 | 8.42 |
| Specialist’s | 33.9 | 31 | 8.36 |
Source: Office of Institutional Research
| Residency* | Traditional UG | % of Enrollment** | Non-Traditional (PACE) UG | % Of Enrollment** | Graduate and Professional | % Of Enrollment** |
|---|---|---|---|---|---|---|
| Florida – Dade & Broward counties | 1,446 | 47% | 84 | 59% | 1,329 | 37% |
| Rest of Florida | 411 | 13% | 15 | 10% | 841 | 23% |
| Florida – Unknown county | 264 | 9% | 29 | 20% | 438 | 12% |
| Florida - Total | 2,121 | 69% | 128 | 90% | 2,608 | 73% |
| Out-of-state | 343 | 11% | 5 | 3% | 202 | 6% |
| Foreign country | 596 | 19% | 10 | 7% | 776 | 22% |
| Unknown | 29 | 1% | 0 | 0% | 7 | 0.2% |
*Students come from 49 states (including Florida), the District of Columbia, and two territories. There are 89 foreign countries represented in the student body (among non-resident aliens). Percentages may not add up to 100% due to rounding error. Source: Office of Institutional Research
| Student Type | Residency | Commuter | Campus Resident | % Campus Resident |
|---|---|---|---|---|
| Traditional Undergraduate | Florida - local | 153 | 41 | 21% |
| Florida - non-local | 8 | 27 | 77% | |
| Florida - unknown | 1,418 | 375 | 21% | |
| Foreign Country | 106 | 165 | 61% | |
| Out-of-state | 150 | 474 | 76% | |
| Unknown | 6 | 18 | 75% | |
| Non-Traditional (PACE) Undergraduate | Florida - local | 53 | ||
| Florida - non-local | 19 | |||
| Florida - unknown | 117 | |||
| Foreign Country | 8 | |||
| Out-of-state | 12 | |||
| Unknown | 0 | |||
| Graduate & Professional | Florida - local | 598 | 3 | 0.5% |
| Florida - non-local | 698 | 3 | 0.4% | |
| Florida - unknown | 1,431 | 20 | 1.4% | |
| Foreign Country | 169 | 24 | 12% | |
| Out-of-state | 690 | 37 | 5% | |
| Unknown | 11 | 2 | 15% |
Source: Office of Institutional Research
| Percent of full-time, first-time degree-seeking undergraduates receiving any financial aid | 100% |
| Percent of full-time, first-time degree-seeking undergraduates receiving federal student loan aid | 66% |
| Percent of all undergraduate students receiving some form of financial aid | 67% |
| Percent of all undergraduates receiving federal student loan aid | 44% |
| Average amount of federal, state, local, or the institutional grant aid received by full-time, first-time degree-seeking undergraduates | $26,872 |
| Average amount of federal student loan aid received by full-time, first-time degree-seeking undergraduates | $5,200 |
Sources: IPEDS 2023-2024 Financial Aid survey
| College/School | Undergraduate | Graduate & Professional | Total | % Undergraduate |
|---|---|---|---|---|
| College of Arts & Sciences (CAS) | 2,040 | 304 | 2,344 | 87% |
| College of Nursing & Health Sciences (CNHS) | 556 | 1,848 | 2,404 | 23% |
| D. Inez Andreas School of Business (BUS) | 636 | 477 | 1,113 | 57% |
| Dwayne O. Andreas School of Law (LAW) | - | 741 | 741 | 0% |
| School of Podiatric Medicine (POD) | - | 223 | 223 | 0% |
Source: Office of Institutional Research
Source: Office of Institutional Research
|
Student Type |
Program/Major |
Enrollment |
% Of Enrollment* |
|
First-time Freshmen |
BSN Pre-Nursing |
100 |
16% |
|
BSBA Management |
63 |
10% |
|
|
BS Pre-Professional Biology |
53 |
8% |
|
|
BA Undeclared/Undecided |
51 |
8% |
|
|
BS Psychology |
43 |
7% |
|
|
Traditional Undergraduate |
BSN Pre-Nursing |
191 |
6% |
|
BSBA Management |
189 |
6% |
|
|
BS Psychology |
164 |
5% |
|
|
BSN Nursing |
142 |
5% |
|
|
BS Pre-Professional Biology |
123 |
4% |
|
|
Non-Traditional (PACE) Undergraduate |
BS Organizational Leadership |
48 |
34% |
|
BPA in Public Administration |
45 |
31% |
|
|
BS Administration |
29 |
20% |
|
|
BS Emergency Management |
15 |
10% |
|
|
BS Information Technology |
4 |
3% |
|
|
Master’s
|
MMS Physician Assistant |
299 |
16% |
|
MS Biomedical Sciences |
292 |
16% |
|
|
MBA Business Administration |
278 |
15% |
|
|
MS Counseling |
234 |
13% |
|
|
MSW Social Work |
134 |
7% |
|
|
Doctoral – Research & Scholarship
|
EDD Organizational Leadership |
84 |
28% |
|
PHD Counseling |
61 |
20% |
|
|
PHD Curriculum and Instruction |
54 |
18% |
|
|
PHD Nursing (Post Master’s) |
49 |
16% |
|
|
PHD Nursing (Post DNP) |
20 |
7% |
|
|
Doctoral – Professional Practice
|
JD Law |
736 |
57% |
|
DPM Podiatric Medicine |
197 |
15% |
|
|
Doctor Nursing Practice (Post Bac) |
185 |
14% |
|
|
Doctor Social Work |
105 |
8% |
|
|
DPM/MBA Podiatry/Business Administration Dual Program |
26 |
2% |
|
|
Specialist’s
|
SSP School Psychology |
18 |
72% |
|
EDS Educational Leadership |
6 |
24% |
|
|
EDS Educational Leadership |
1 |
4% |
|
College/School |
Undergraduate |
Graduate & Professional |
||
|
Program/Major |
Enrollment |
Program/Major |
Enrollment |
|
|
College of Arts & Sciences |
BS Psychology |
164 |
EDD Organizational Leadership |
84 |
|
BS Pre-Professional Biology |
123 |
PHD Curriculum and Instruction |
54 |
|
|
BA Undeclared/Undecided |
89 |
MS Clinical Psychology |
29 |
|
|
College of Nursing & Health Sciences |
BSN Pre- Nursing |
191 |
MMS Physician Assistant |
299 |
|
BSN Nursing |
142 |
MS Biomedical Sciences |
292 |
|
|
BS Appl Sport Exercise Science |
58 |
MS Counseling |
234 |
|
|
D. Inez Andreas School of Business |
BSBA Management |
189 |
MBA Business Administration |
278 |
|
BSBA Finance |
89 |
MPA Public Administration |
114 |
|
|
BS Sport Mgmt. & Business Admin |
48 |
MS Leadership and Innovation |
29 |
|
|
BS Organizational Leadership |
38 |
EDD Organizational Leadership |
71 |
|
|
BS in Education w/ESOL/Reading End |
22 |
PHD Counseling |
56 |
|
|
Dwayne O. Andreas School of Law |
- |
|
JD LAW |
736 |
|
- |
|
- |
|
|
|
School of Podiatric Medicine |
- |
|
DPM Podiatric Medicine |
197 |
|
- |
|
DPM Podiatric Medicine/MBA |
26 |
|
Source: Office of Institutional Research
| Admission Category | Enrollment Funnel | Men | Women | Total* | Yield |
|---|---|---|---|---|---|
| First-time, Degree-seeking First-year Students | Applied | 4,095 | 6,720 | 10,879 | |
| Admitted | 3,040 | 5,310 | 8,384 | 77% | |
| Enrolled Full-time | 241 | 385 | 626 | 7% | |
| Enrolled Part-time | 0 | 1 | 1 | ||
| Traditional, Degree-seeking Transfer Students | Applied | 696 | 1,051 | 1,767 | |
| Admitted | 300 | 448 | 757 | 43% | |
| Enrolled Full-time | 72 | 76 | 148 | 21% | |
| Enrolled Part-time | 4 | 9 | 13 |
*Total figures may not add to gender totals due to applicants who did not disclose their gender.
Sources: Division of Enrollment Management and Office of Institutional Research
| College Readiness Assessment | N | Average | 25th Percentile | 75th Percentile |
|---|---|---|---|---|
| High School GPA | 627 | 3.51 | 3.07 | 3.93 |
| SAT Total | 196 | 1,000 | 910 | 1,100 |
| SAT Mathematics | 196 | 480 | 430 | 532 |
| SAT EBRW | 196 | 520 | 470 | 570 |
| ACT Composite | 56 | 20 | 17 | 23 |
| ACT English | 56 | 20 | 17 | 22 |
| ACT Math | 56 | 17 | 15 | 22 |
*From 626 students in the cohort, 31% had valid SAT scores, 9% had valid ACT scores, 100% had valid High School GPA scores. SAT Evidence-Based Reading and Writing and Math scores are reported based on the new (2016) SAT score range 200-800.
Source: Office of Institutional Research
| Class Size | Total |
|---|---|
| Total Number of Students in all Sessions | 9,327 |
| Total Number of Sections | 506 |
| Mean Section Size | 18 |
| Undergraduate section enrollment -to-Undergraduate headcount enrollment ratio | 3.0 |
| Student to faculty ratio | 7:1 |
Source: Office of Institutional Research and Office of the Registrar
| Fall 2018 Student Group | No. of Students |
Not Graduated/still Enrolled as of Fall 2024 |
Transfer-out Rate at 150% of Normal Time |
Graduation Rate at 100% of Normal Time |
Graduation Rate at 150% of Normal Time |
|
|---|---|---|---|---|---|---|
| All students | 639 | 1% | 25% | 20% | 38% | |
| Gender | Male | 173 | 1% | 29% | 12% | 31% |
| Female | 466 | 1% | 23% | 23% | 40% | |
| Race/ Ethnicity | Non-resident alien | 29 | 0% | 0% | 41% | 62% |
| Hispanic | 250 | 2% | 24% | 23% | 41% | |
| American Indian or Alaskan Native | 4 | 0% | 50% | 25% | 25% | |
| Asian | 1 | 0% | 0% | 0% | 0% | |
| Black or African American | 241 | 0% | 26% | 13% | 32% | |
| Native Hawaiian or Pacific Islander | 2 | 0% | 50% | 0% | 50% | |
| White | 89 | 0% | 33% | 24% | 36% | |
| Two or more races | 16 | 0% | 19% | 25% | 50% | |
| Unknown | 7 | 0% | 29% | 14% | 29% | |
| Financial Aid Status | Pell grant recipients | 442 | 1% | 24% | 19% | 38% |
| Recipients of Direct Subsidized Loan without Pell grant | 76 | 4% | 37% | 17% | 32% | |
| Received neither Pell grant nor Direct Subsidized Loan | 121 | 1% | 21% | 28% | 40% | |
| First Generation | First Generation Status | 245 | 0% | 27% | 18% | 37% |
Source: Office of Institutional Research
| Fall 2023 Student group |
No. of Students | Transfer-out Rate | Retention Rate | |
|---|---|---|---|---|
| All students | 576 | 20% | 63% | |
| Gender | Male | 211 | 17% | 64% |
| Female | 365 | 22% | 63% | |
| Race/ Ethnicity | Non-resident alien | 73 | 1% | 67% |
| Hispanic | 182 | 21% | 69% | |
| American Indian or Alaskan Native | 1 | 0% | 100% | |
| Asian | 10 | 30% | 50% | |
| Black or African American | 232 | 24% | 58% | |
| Native Hawaiian or Pacific Islander | 1 | 0% | 100% | |
| White | 54 | 31% | 69% | |
| Two or more races | 21 | 26% | 52% | |
| Unknown | 2 | 0% | 50% | |
| Financial Aid Status | Pell grant recipients | 336 | 24% | 59% |
| Recipient of Direct Subsidized Loan without Pell grant | 58 | 25% | 59% | |
| Received neither Pell grant nor Direct Subsidized Loan | 182 | 20% | 67% | |
| First Generation | First Generation Status | 143 | 28% | 55% |
Source: Office of Institutional Research
Source: Department of Human Resources
Note: Racial/Ethnic Minority group includes American Indian or Alaska Native, Asian, Black or African American, Hispanic, and Two or More Races. Source: Department of Human Resources
| Primary Occupation | Full-time | Part-time | Total | FTE* |
|---|---|---|---|---|
| Educational Occupations | 255 | 647 | 902 | 471 |
| Archivists, Curators, and Museum Technicians | 0 | 1 | 1 | 0 |
| Library | 10 | 1 | 11 | 10 |
| Library Technicians | 12 | 6 | 18 | 14 |
| Student & Academic Affairs & Other Education Services | 16 | 18 | 34 | 22 |
| Management | 167 | 0 | 167 | 167 |
| Business & Financial Operations | 34 | 1 | 35 | 34 |
| Computer, Engineering & Science | 31 | 6 | 37 | 33 |
| Community Service, Legal Arts & Media | 99 | 29 | 128 | 109 |
| Healthcare Practitioners & Technical | 33 | 9 | 42 | 36 |
| Service | 16 | 0 | 16 | 16 |
| Office & Administrative Support | 127 | 21 | 148 | 134 |
| Production, Transportation, and Material Moving Occupations | 0 | 2 | 2 | 1 |
| Natural Resources, Construction & Maintenance | 13 | 0 | 13 | 13 |
| Total** | 813 | 741 | 1,554 | 1,060 |
*In this instance, FTE is calculated by adding full-time figures to one third of part-time counts. ** Graduate assistants are not counted. Source: Office of Institutional Research
Percentages may not add up to 100% due to rounding error. Source: Office of Institutional Research
| Primary Occupation | Women | % Women | Men | % Men |
|---|---|---|---|---|
| Educational Occupations | 499 | 55% | 403 | 45% |
| Archivists, Curators, and Museum Technicians | 1 | 100% | 0 | 0% |
| Librarians | 8 | 73% | 3 | 27% |
| Library Technicians | 12 | 67% | 6 | 33% |
| Student & Academic Affairs & Other Education Services | 15 | 44% | 19 | 56% |
| Management | 115 | 69% | 52 | 31% |
| Business & Financial Operations | 26 | 74% | 9 | 26% |
| Computer, Engineering & Science | 20 | 54% | 17 | 46% |
| Community Service, Legal Arts & Media | 62 | 48% | 66 | 52% |
| Healthcare Practitioners & Technical | 25 | 60% | 17 | 40% |
| Service | 10 | 63% | 6 | 38% |
| Office & Administrative Support | 123 | 83% | 25 | 17% |
| Production, Transportation, and Material Moving Occupations | 0 | 0% | 2 | 100% |
| Natural Resources, Construction & Maintenance | 1 | 8% | 12 | 92% |
| Total* | 917 | 59% | 637 | 41% |
* Graduate assistants are not counted. Source: Office of Institutional Research
| Ethnicity by Gender | Faculty | % Faculty | Administrative Staff | % Admin. Staff | % Faculty & Staff | ||
|---|---|---|---|---|---|---|---|
| Women | Men | Total | Women | Men | Total | Total | |
| Non-resident Alien | 4 | 6 | 1% | 16 | 9 | 4% | 2% |
| Hispanic | 123 | 104 | 25% | 150 | 67 | 32% | 28% |
| American Indian | - | 1 | 0% | 1 | - | 0% | 0% |
| Asian | 21 | 15 | 4% | 13 | 8 | 3% | 4% |
| Black or African American | 90 | 42 | 15% | 89 | 46 | 20% | 17% |
| Native Hawaiian or Other Pacific Islander | 0 | 1 | 0% | 0 | 0 | 0% | 0% |
| White | 207 | 197 | 45% | 113 | 87 | 29% | 38% |
| Two or more races | 11 | 5 | 2% | 8 | 2 | 1% | 2% |
| Unknown | 43 | 32 | 8% | 47 | 23 | 10% | 9% |
| Grand Total* | 499 | 403 | 100% | 437 | 242 | 100% | 100% |
* Graduate assistants are not counted. Percentages may not add up to 100% due to rounding error.
Source: Office of Institutional Research
Source: Office of Institutional Research
| Rank | 9-month | 10-month | 12-month | Total |
|---|---|---|---|---|
| Professor | 40 | 10 | 22 | 72 |
| Associate Professor | 49 | 7 | 23 | 79 |
| Assistant Professor | 44 | 3 | 37 | 84 |
| Instructor | 15 | 0 | 5 | 20 |
| Total* | 148 | 20 | 87 | 255 |
*Staff with academic rank and a primary position other than teaching are not included into a total count. Source: Office of Institutional Research
| Rank | Annual | Multi-year | Tenured** | Tenure-track** | Total |
|---|---|---|---|---|---|
| Professor | 2 | 62 | 8 | 0 | 72 |
| Associate Professor | 4 | 62 | 13 | 0 | 79 |
| Assistant Professor | 2 | 64 | 18 | 0 | 84 |
| Instructor | 18 | 2 | 0 | 0 | 20 |
| Total* | 26 | 190 | 39 | 0 | 255 |
*Staff with academic rank and a primary position other than teaching are not included into a total count.
**Dwayne O. Andreas School of Law Faculty. Source: Office of Institutional Research
| School/College | Full-Time | Part-Time | FT-PT Ratio |
|---|---|---|---|
| College of Arts & Sciences | 24% | 76% | 0.3 |
| College of Health and Wellness | 25% | 75% | 0.3 |
| School of Business and Public Administration | 40% | 60% | 0.7 |
| School of Law | 47% | 53% | 0.9 |
| School of Podiatric Medicine | 58% | 42% | 1.4 |
Source: Department of Human Resources
| College/School | Number of Undergraduate Programs/Majors |
Number of Graduate Programs/Majors |
Total* |
|---|---|---|---|
| College of Arts & Sciences | 38 | 24 | 62 |
| College of Nursing & Health Sciences | 7 | 15 | 22 |
| D. Inez Andreas School of Business | 7 | 7 | 14 |
| Dwayne O. Andreas School of Law | 0 | 1 | 1 |
| School of Podiatric Medicine | 0 | 1 | 1 |
| Total | 52 | 48 | 100 |
*Total category is based on degree programs only (not counting seamless or dual options, specializations, minors, or non-degree certificates). Sources: Undergraduate and Graduate catalogs
| College/School | Undergraduate Minors |
Undergraduate Specializations |
Graduate Specializations |
|---|---|---|---|
| College of Arts & Sciences | 44 | 37 | 23 |
| College of Nursing & Health Sciences | 4 | 4 | 5 |
| D. Inez Andreas School of Business | 7 | 8 | |
| Dwayne O. Andreas School of Law | - | - | - |
| School of Podiatric Medicine | - | - | - |
| Total | 55 | 41 | 36 |
Barry University also offers dual programs such as JD/MBA, DPM/MBA, and MSN/MBA. For a complete list of dual programs please refer to academic catalogs available at https://www.barry.edu/en/registrar/catalogs/ Sources: 2024-25 Undergraduate and Graduate catalogs
| Program | Degree Level | Academic Level | School/College |
|---|---|---|---|
| Information Technology | BS | Undergraduate | College of Arts & Sciences |
| Information Technology Portfolio Option | BS | Undergraduate | |
| Administration | BS | Undergraduate | |
| Organizational Leadership | BS | Undergraduate | |
| Organizational Leadership seamless | BS/MS | UG/GR | |
| Administration | MAA | Graduate | |
| Curriculum and Instruction | MS | Graduate | |
| Educational Leadership w/ cert | MS | Graduate | |
| Educational Leadership w/o cert | MS | Graduate | |
| Exceptional Studies Education | MS | Graduate | |
| Higher Education Administration | MS | Graduate | |
| Human Resource Development | MS | Graduate | |
| Reading (Non – Certification) | MS | Graduate | |
| Educational Leadership w/cert | EDS | Graduate | |
| Educational Leadership w/o cert | EDS | Graduate | |
| Education in Transform. Sch. Leadership | EDD | Doctoral | |
| Health Services Administration | BS | Undergraduate | College of Nursing & Health Sciences |
| Nursing Practice (Post Graduate) | DNP | Doctoral | |
| Nursing (BSN-PHD) | PHD | Doctoral | |
| Nursing (Post Master’s) | PHD | Doctoral | |
| Nursing (Post DNP) | PHD | Doctoral | |
| Occupational Therapy | OTD | Doctoral | |
| Social Work | MSW | Graduate | |
| Social Work Advance Standing | MSW | Graduate | |
| Social Work | DSW | Doctoral | |
| Public Administration | BPA | Undergraduate | School of Business |
| Emergency Management | BS | Undergraduate | |
| Public Administration | Certificate | Undergraduate | |
| Business Administration | MBA | Graduate | |
| Public Administration | MPA | Graduate | |
| Accounting | MSA | Graduate | |
| Sport Management and Business Administration | MS | Graduate |
Source: Office of the Registrar


